The markets closed lower last week as investors reacted to the possibility of additional tariffs from the Trump administration, the potential for rising inflation, a weak earnings report from a major Megacap, and a lower-than-expected jobs report. Of the indexes listed here, only the Global Dow managed to eke out a weekly gain. The remaining indexes closed lower, led by the Dow and the NASDAQ. Ten-year Treasury yields rebounded last Friday, but not enough to keep from ending last week lower. Crude oil prices declined nearly 3.5%, primarily due to increasing trade tensions, particularly with China.
Wall Street reacted bearishly last Monday following the White House's announcement of tariffs on imports from Mexico, Canada, and China. Stocks got a minor boost later in the day after tariffs on Mexican and Canadian imports were temporarily delayed by President Trump. Nevertheless, each of the benchmark indexes listed here ended the day in the red, with the Russell 2000 and the NASDAQ both falling 1.2%. The Global Dow declined 1.1%. The S&P 500 gave back 0.8%, while the Dow lost 0.3%. Crude oil prices inched up 0.5% to settle at $72.88 per barrel. However, tariffs on crude oil imports from Canada and Mexico, if reinstituted, could send prices higher for gasoline and heating oil. Ten-year Treasury yields closed at 4.54%. The dollar and gold prices ticked higher.
Stocks reversed course last Tuesday, ending the trading session higher as investors contemplated the latest tensions concerning global trade. Traders got some encouragement following President Trump's postponement of tariffs on Canada and Mexico for at least 30 days. The Russell 2000 and the NASDAQ each gained 1.4% to lead the benchmark indexes listed here. The S&P 500 and the Global Dow each rose 0.7%, while the Dow climbed 0.3%. Ten-year Treasury yields slipped to 4.51%. Crude oil prices declined to $72.53 per barrel. The dollar index lost 0.9%, while gold prices increased 0.6%.
Last Wednesday saw stocks push higher for the second straight day. The Russell 2000 climbed 1.1%, followed by the Global Dow (0.8%), the Dow (0.7%), and the NASDAQ (0.2%). Yields on 10-year Treasuries slid 9.1 basis points to 4.42%, a seven-week low. Crude oil prices fell 2.1%, settling at $71.18 per barrel after a report that showed a larger-than-expected rise in U.S. crude oil inventories. The dollar slipped 0.3%, while gold prices rose 0.2%.
The benchmark indexes listed here closed last Thursday with mixed results as investors awaited earnings reports from some major companies and Friday's jobs report. The Dow (-0.3%) and the Russell 2000 (-0.4%) declined. The NASDAQ and the Global Dow rose 0.5%, while the S&P 500 advanced 0.4%. Ten-year Treasury yields inched up to 4.44%. Crude oil prices continued to tumble, falling to $70.54 per barrel. The dollar ticked up 0.1%, while gold prices fell 0.4%.
Stocks tumbled to close out the week last Friday. Each of the benchmark indexes listed here ended the session in the red, led by the NASDAQ, which lost 1.4%. The Russell 2000 slid 1.2%, while both the Dow and the S&P 500 fell 1.0%. The Global Dow dipped 0.5%. Ten-year Treasury yields added 4.7 basis points to close at 4.48%. Crude oil prices rose 0.5%. The dollar index gained 0.3%, while gold prices advanced 0.4%.
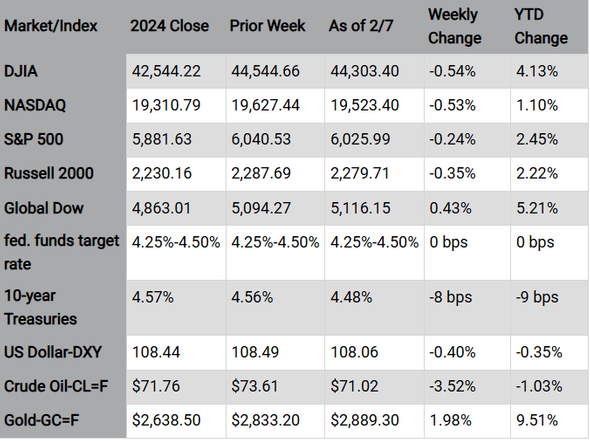
Chart reflects price changes, not total return. Because it does not include dividends or splits, it should not be used to benchmark performance of specific investments.
Last Week's Economic News
- There were 143,000 new jobs added in January, which fell short of expectations. However, upward revisions in November (+49,000) and December (+51,000) combined to account for 100,000 new jobs. In January, job gains occurred in health care, retail trade, and social assistance. Employment declined in the mining, quarrying, and oil and gas extraction industry. The unemployment rate dipped 0.1 percentage point to 4.0% in January, and the total number of unemployed changed little at 6.8 million. The number of long-term unemployed (those jobless for 27 weeks or more), at 1.4 million, declined by about 100,000 in January and accounted for 21.1% of all unemployed persons. Last month, both the labor participation rate (62.6%) and the employment-population ratio (60.1%) ticked up 0.1 percentage point. In January, average hourly earnings rose by $0.17, or 0.5%, to $35.87. Over the past 12 months, average hourly earnings have increased by 4.1%. The average workweek edged down by 0.1 hour to 34.1 hours in January.
- Manufacturing expanded in January amid a surge in confidence. Both output and new orders grew last month. New business increased for the first time since June 2024 on improving customer demand and greater confidence in the economy. According to the S&P Global US Manufacturing Purchasing Managers' Index™, the PMI® rose to 51.2 in January, up from 49.4 in December.
- Growth continued in the services sector in January but at a slower pace than in the previous month. The S&P Global US Services PMI® registered 52.9 in January, down from 56.8 in December. The survey of purchasing managers by S&P Global noted that business activity slowed in January as new orders declined somewhat. In fact, some survey respondents reported that the unusually freezing weather conditions seen in parts of the country may have been behind the slowdown in growth. Despite the slowdown in output, job creation reached a 31-month high as more than 42% of respondents predicted an increase in activity over the coming year.
- The number of job openings declined by about 560,000 in December, according to the latest Job Openings and Labor Turnover Summary. The number of job openings decreased by 1.3 million in 2024 from a year earlier. The number of job openings decreased in professional and business services, health care and social assistance, and finance and insurance. Job openings increased in arts, entertainment, and recreation. In December, the number of hires changed little at 5.5 million but was down by 325,000 over the year. Total separations in December, which include quits, layoffs and discharges, and other separations, were relatively unchanged at 5.3 million. In December, the number of quits was little changed at 3.2 million but declined by 242,000 over the year.
- The goods and services trade deficit was $98.4 billion in December, up $19.5 billion, or 24.7%, from the November deficit. December exports were $266.5 billion, $7.1 billion, or 2.6%, less than November exports. December imports were $364.9 billion, $12.4 billion, or 3.5%, more than November imports. For 2024, the goods and services deficit increased $133.5 billion, or 17.0%, from 2023. Exports increased $119.8 billion, or 3.9%. Imports increased $253.3 billion, or 6.6%.
- The national average retail price for regular gasoline was $3.082 per gallon on February 3, $0.021 per gallon below the prior week's price and $0.054 per gallon less than a year ago. Also, as of February 3, the East Coast price fell $0.057 to $3.019 per gallon; the Midwest price decreased $0.027 to $2.919 per gallon; the Gulf Coast price rose $0.013 to $2.709 per gallon; the Rocky Mountain price advanced $0.047 to $2.967 per gallon; and the West Coast price increased $0.043 to $3.924 per gallon.
- For the week ended February 1, there were 219,000 new claims for unemployment insurance, an increase of 11,000 from the previous week's level, which was revised up by 1,000. According to the Department of Labor, the advance rate for insured unemployment claims for the week ended January 25 was 1.2%. The advance number of those receiving unemployment insurance benefits during the week ended January 25 was 1,886,000, an increase of 36,000 from the previous week's level, which was revised down by 8,000. States and territories with the highest insured unemployment rates for the week ended January 18 were New Jersey (2.9%), Rhode Island (2.8%), Minnesota (2.5%), Illinois (2.4%), Massachusetts (2.4%), Washington (2.3%), California (2.2%), Michigan (2.2%), Montana (2.2%), Alaska (2.0%), Pennsylvania (2.0%), and Puerto Rico (2.0%). The largest increases in initial claims for unemployment insurance for the week ended January 25 were in Washington (+441), Iowa (+317), Wisconsin (+151), Kansas (+67), and Wyoming (+2), while the largest decreases were in California (-14,003), Michigan (-9,589), Missouri (-4,144), Illinois (-3,220), and Texas (-2,352).
Eye on the Week Ahead
Inflation data for January is available this week with the release of the latest Consumer Price Index report. December saw prices rise 0.4% for the month and 2.9% for the 12 months ended in December.
Key Dates/Data Releases
2/12: Consumer Price Index, monthly Treasury statement
2/13: Producer Price Index
2/14: Retail sales, import and export prices, industrial production
Data sources: Economic: Based on data from U.S. Bureau of Labor Statistics (unemployment, inflation); U.S. Department of Commerce (GDP, corporate profits, retail sales, housing); S&P/Case-Shiller 20-City Composite Index (home prices); Institute for Supply Management (manufacturing/services). Performance: Based on data reported in WSJ Market Data Center (indexes); U.S. Treasury (Treasury yields); U.S. Energy Information Administration/Bloomberg.com Market Data (oil spot price, WTI, Cushing, OK); www.goldprice.org (spot gold/silver); Oanda/FX Street (currency exchange rates).
News items are based on reports from multiple commonly available international news sources (i.e., wire services) and are independently verified when necessary with secondary sources such as government agencies, corporate press releases, or trade organizations. All information is based on sources deemed reliable, but no warranty or guarantee is made as to its accuracy or completeness. Neither the information nor any opinion expressed herein constitutes a solicitation for the purchase or sale of any securities, and should not be relied on as financial advice. Forecasts are based on current conditions, subject to change, and may not come to pass. U.S. Treasury securities are guaranteed by the federal government as to the timely payment of principal and interest. The principal value of Treasury securities and other bonds fluctuates with market conditions. Bonds are subject to inflation, interest-rate, and credit risks. As interest rates rise, bond prices typically fall. A bond sold or redeemed prior to maturity may be subject to loss. Past performance is no guarantee of future results. All investing involves risk, including the potential loss of principal, and there can be no guarantee that any investing strategy will be successful.
The Dow Jones Industrial Average (DJIA) is a price-weighted index composed of 30 widely traded blue-chip U.S. common stocks. The S&P 500 is a market-cap weighted index composed of the common stocks of 500 largest, publicly traded companies in leading industries of the U.S. economy. The NASDAQ Composite Index is a market-value weighted index of all common stocks listed on the Nasdaq stock exchange. The Russell 2000 is a market-cap weighted index composed of 2,000 U.S. small-cap common stocks. The Global Dow is an equally weighted index of 150 widely traded blue-chip common stocks worldwide. The U.S. Dollar Index is a geometrically weighted index of the value of the U.S. dollar relative to six foreign currencies. Market indexes listed are unmanaged and are not available for direct investment.
This material was written and prepared by Broadridge Advisor Solutions. © 2006-2019 Broadridge Investor Communication Solutions, Inc. Broadridge Investor Communication Solutions, Inc. does not provide investment, tax, or legal advice. The information presented here is not specific to any individual's personal circumstances. To the extent that this material concerns tax matters, it is not intended or written to be used, and cannot be used, by a taxpayer for the purpose of avoiding penalties that may be imposed by law. Each taxpayer should seek independent advice from a tax professional based on his or her individual circumstances. These materials are provided for general information and educational purposes based upon publicly available information from sources believed to be reliable—we cannot assure the accuracy or completeness of these materials. The information in these materials may change at any time and without notice.
Prepared by Broadridge Investor Communication Solutions, Inc., copyright 2025.