
Indiana Trust Wealth Management
Investment Advisory Services
by Clayton T. Bill, CFA
Vice President, Director of Investment Advisory Services
- The U.S. equity market, represented by the S&P 500 index, slipped 0.2% for the week.
- Will the persistently higher level of interest rates since 2022 eventually lead to pain in the US stock market?
Theoretically, a stock price is the present value of all the expected future cash flows (e.g., profits) per share that a company will generate as a going concern. When interest rates rise, the present value of those cash flows falls, all else equal. This is sometimes referred to as the “time value of money” (and is also why bond prices move inversely with bond yields).
In 2022, rising interest rates were viewed as a key driver pushing down stock prices. The bellwether 10-year US Treasury note began that year yielding 1.5%. It ended yielding 3.75%, a dramatic increase in long-term interest rates from such a low level.
At the time, higher interest rates were also expected to be a significant drag on economic activity and thus future earnings growth. So, not only did the time value of money “math” of higher interest rates hurt stock prices, but future profits were expected to be lower because of the now-higher level of interest rates - sort of a “double whammy” for stocks in 2022.
For a variety of reasons, the post-2022 economy was good despite higher interest rates. Corporate profits stumbled but recovered quickly. The S&P 500’s three-year average annual return from 2022 through 2024 was 8% per year - a terrific outcome, given the index fell 19% in 2022.
Will the now higher level of interest rates eventually kick in and take the steam out of stocks? The chart below from Goldman Sachs (via author Sam Ro) helps explain why the level of interest rates on its own may not mean stocks will suffer. The horizontal axis reflects how volatile interest rates have moved over one-month periods since 2006. Moving right from the middle green bar at the bottom, the more sharply interest rates have moved up. Moving left from the green bar, the more suddenly rates have fallen. The middle of the chart – where the green bar sits – is where rates haven’t done much moving at all.
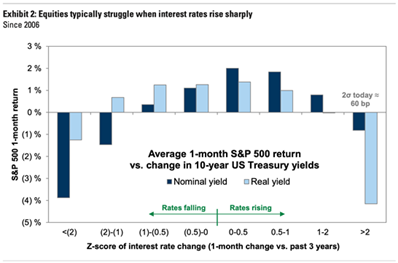
Sources: Sam Ro, Goldman Sachs Global Investment Research, 2025
Returns on the S&P 500 (the vertical axis) were most negative during those months when interest rates have been most volatile, whether rates made sudden moves up or down. Stocks performed best when rates were calm, the middle of the chart. Interestingly, the best one-month stock returns have been during periods of slowly increasing interest rates.
The level of rates is part of the equation, but equity investors appear to place value on a calm interest rate environment.
__________
IMPORTANT DISCLOSURES: All info contained herein is solely for general informational purposes. It does not take into account all the circumstances of each investor and is not to be construed as legal, accounting, investment, or other professional advice. The author(s) and publisher, accordingly, assume no liability whatsoever in connection with the use of this material or action taken in reliance thereon. All reasonable efforts have been made to ensure this material is correct at the time of publication.
Copyright Indiana Trust Wealth Management 2025.