Indiana Trust Wealth Management
Investment Advisory Services
by Clayton T. Bill, CFA
Vice President, Director of Investment Advisory Services
- The U.S. equity market, represented by the S&P 500 index, slipped 0.6% for the week.
- 2024 has been an outstanding year for US stocks. Do rising valuations present a near-term concern?
2024 has been quite a year for the US stock market. The S&P 500 is up 27%. The worst peak-to-trough drawdown was only 8%, well below the average drawdown (14%) for a calendar year. There have been 56 all-time highs, which equates to a new high every four trading days. There have been only three down days of -2% or worse.
Beneath the ebullience, concerns are percolating about rising stock market valuations. The market’s forward price-to-earnings ratio (P/E) is well above its 30-year average, standing at about 23x next year’s earnings. It looks expensive out there.
While comparing the current P/E ratio to a historical average is a good temperature check, it is a notoriously poor predictor of near-term returns. P/E ratios are only slightly better at predicting medium- and long-term returns. In other words, valuation multiples may not be mean reverting. The market can remain “expensive” or “cheap” for long periods of time.
Most market strategists are looking through the market’s rising valuation and are predicting another good year for stocks in 2025. Their optimism is largely based upon strong earnings growth expectations over the next two years.
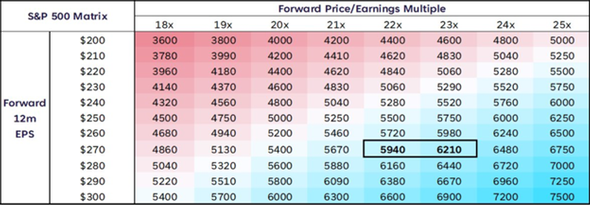
Liz Young Thomas, the market strategist for SoFi, published the below matrix showing the current S&P 500 P/E multiple based upon 2025’s expected earnings is between 22x and 23x (see bolded box). She notes that consensus earnings per share (EPS) for 2026 now stands at $303. If the multiple does not change next year, the S&P 500 index could reach 6600 – 6900 by the end of 2025, implying a 10%+ return:

Source: Liz Young Thomas, SoFi, December 14, 2024
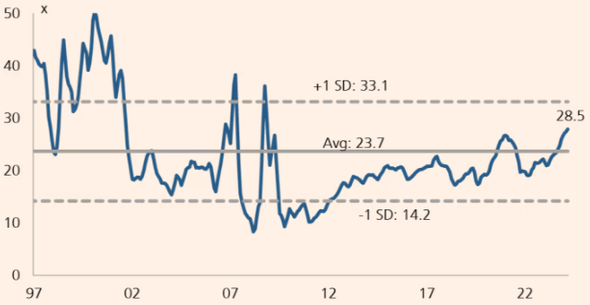
Still, a forward P/E multiple of 23x is rather lofty. Is there any sane rationale for a persistently elevated market P/E? The best argument may be that large companies in the S&P 500, such as Nvidia, have become more tech-heavy and capital-light over time. As a result, they generate more free cash flow per dollar of sales than big companies did in the past. On a price-to-free cash flow basis, the market does not look quite as expensive relative to history:

Source: UBS, Alexandra Scaggs, FT, December 10, 2024
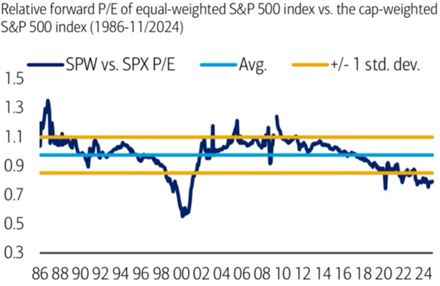
Finally, the market’s P/E is a market cap-weighted metric, and high valuations have been attached to the largest market cap stocks in the market. So, in a sense, the market P/E is top heavy and somewhat inflated as a result. A neat chart from BofA Global Research shows that the P/E of the equal-weighted S&P 500 (SPW) is at a record discount to the market cap-weighted index (SPX). The average stock in the market trades at a record discount to the market-cap weighted index:

Source: BofA Global Research, December 2024
How can investors guard against valuation compression on the largest US stocks? Thoughtfully measured allocations to stocks outside the US can provide meaningful diversification benefits, as witnessed post-2002. Rebalancing portfolios within and across asset classes remains a critical risk-management tool, as well.
Editor’s Note: Our weekly update will return in 2025. We wish all our clients, partners in our communities, and professional colleagues a safe and happy holiday season!
__________
IMPORTANT DISCLOSURES: All info contained herein is solely for general informational purposes. It does not take into account all the circumstances of each investor and is not to be construed as legal, accounting, investment, or other professional advice. The author(s) and publisher, accordingly, assume no liability whatsoever in connection with the use of this material or action taken in reliance thereon. All reasonable efforts have been made to ensure this material is correct at the time of publication.
Copyright Indiana Trust Wealth Management 2024.
