Investors were confronted with plenty of market-moving information last week as they waded through negative developments and some positive signs. Growing tensions in the Middle East and a slowdown in the manufacturing sector (see below) were causes for concern, while a better-than-expected jobs report (see below) helped alleviate some of those worries, at least for a time. The S&P 500, the NASDAQ, and the Dow ended a very volatile week on the plus side, while the Russell 2000 and the Global Dow closed the week lower. Among the market sectors, energy surged by more than 8.5%, while communication services, financials, and industrials also closed higher. The remaining sectors declined, led by real estate and materials. Ten-year Treasury yields surged to their highest level in nearly two months as the robust labor report cooled expectations that the Federal Reserve needed to aggressively cut interest rates.
The stock market spent most of last Monday in negative territory, facing selling pressures, only to rally at the close of the session. The S&P 500 and the NASDAQ each gained 0.4%, the Russell 2000 added 0.2%, while the Dow was flat. The Global Dow declined 0.5%. Ten-year Treasury yields rose 5.3 basis points to settle at 3.80%. Crude oil prices inched up 0.1% to $68.24 per barrel. The dollar and gold prices fell marginally.
Stocks slid lower last Tuesday amid rising tensions in the Middle East. Investors also had to consider a slowdown in manufacturing activity (see below), although job openings rose unexpectedly in August, evidencing that the lag in the labor market may not be quite so pronounced. All of the benchmark indexes listed here lost value, led by the Russell 2000 and the NASDAQ, each of which declined 1.5%. The S&P 500 fell 0.9%, the Global Dow dipped 0.5%, and the Dow slid 0.4%. Crude oil prices rose 3.6%, reaching $70.64 per barrel. Ten-year Treasury yields fell 5.9 basis points to 3.74%. The dollar rose 0.4% against a basket of currencies, while gold prices advanced 0.8%.
The benchmark indexes listed here closed mostly higher last Wednesday, with the exception of the Russell 2000 and the Global Dow, each of which slipped 0.1% lower. The S&P 500, the Dow, and the NASDAQ inched up by about 0.1%. Ten-year Treasury yields rose to 3.78%. Crude oil prices continued to advance, settling at $70.90 per barrel. The dollar gained 0.4%, while gold prices fell 0.4%.
Stocks closed lower last Thursday as escalating tensions in the Middle East and the dock workers' strike were concerns for investors. The small caps of the Russell 2000 led the declines, falling 0.7%, followed by the Global Dow (-0.6%), the Dow (-0.4%), and the S&P 500 (-0.2%). The NASDAQ dipped less than 0.1%. Crude oil prices vaulted 5.3%, reaching $73.82 per barrel. Ten-year Treasury yields rose 6.5 basis points to 3.85%. The dollar and gold prices each rose 0.3%.
Last Friday saw stocks move higher on the heels of a strong jobs report, which quelled, at least temporarily, investors' concerns over Middle East tensions. The Russell 2000 gained 1.5%, followed by the NASDAQ (1.2%), the S&P 500 (0.9%), and the Dow (0.8%), which reached another record high. The Global Dow rose 0.6%. Yields on 10-year Treasuries vaulted 13.1 basis points to close at 3.98% as bond prices declined. Crude oil prices gained 1.0%, the dollar advanced 0.5%, while gold prices slid 0.3%.
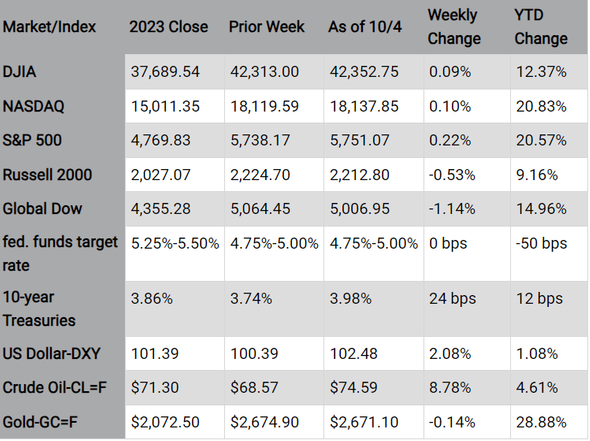
Chart reflects price changes, not total return. Because it does not include dividends or splits, it should not be used to benchmark performance of specific investments.
Last Week's Economic News
- The employment sector showed major signs of life in September. Total employment expanded by 254,000 last month, exceeding expectations and well above the 12-month average of 203,000. The September increase follows upward revisions to both the July and August estimates, which combined were 72,000 higher than previously reported. The unemployment rate, at 4.1%, ticked down 0.1 percentage point from August, while the number of unemployed decreased by 281,000 to 6.8 million. The labor force participation rate was unchanged at 62.7%, while the employment-population ratio rose 0.2 percentage point to 60.2%. The number of unemployed for at least 27 weeks increased by 97,000 to 1.6 million. In September, the long-term unemployed accounted for 23.7% of all unemployed people. In September, average hourly earnings increased by $0.13, or 0.4%, to $35.36. Over the past 12 months, average hourly earnings have increased by 4.0%. The average workweek edged down by 0.1 hour to 34.2 hours in September.
- According to the S&P Global survey of purchasing managers, the manufacturing sector moved deeper into contraction in September. The S&P Global US Manufacturing Purchasing Managers' Index™ remained below the 50.0 no-change mark in September, dipping to 47.3 from 47.9 in August. The manufacturing sector regressed for three consecutive months, with September's reading the most pronounced decline since June 2023. Central to the drop in manufacturing was a sharp fall in new orders amid a slowdown in the overall economy, and uncertainty around the upcoming presidential election.
- While the manufacturing sector may be waning, the services sector is showing strength. A reduction in interest rates helped increase new orders and boost services activity in September, according to the latest S&P Global survey of purchasing managers. New business continued to rise solidly, leading to a build-up of unfinished work as companies were cautious with regards to hiring in the face of strong cost pressures. In fact, input prices rose at the joint-fastest pace in a year, with selling price inflation also accelerating. The S&P Global US Services PMI® Business Activity Index posted 55.2 in September, down from 55.7 in August but still a marked monthly increase in the services sector, which has now increased in each of the last 20 months.
- The number of job openings increased in August, according to the latest data from the Job Openings and Labor Turnover Summary. At roughly 8.0 million, job openings increased by 329,000. The number of hires was essentially unchanged at 5.3 million, while total separations, at 5.0 million, declined by 317,000.
- The national average retail price for regular gasoline was $3.179 per gallon on September 30, $0.006 per gallon below the prior week's price and $0.619 per gallon less than a year ago. Also, as of September 30, the East Coast price rose $0.008 to $3.060 per gallon; the Midwest price increased $0.028 to $3.105 per gallon; the Gulf Coast price fell $0.038 to $2.695 per gallon; the Rocky Mountain price dipped $0.019 to $3.415 per gallon; and the West Coast price decreased $0.069 to $4.042 per gallon.
- For the week ended September 28, there were 225,000 new claims for unemployment insurance, an increase of 6,000 from the previous week's level, which was revised up by 1,000. According to the Department of Labor, the advance rate for insured unemployment claims for the week ended September 21 was 1.2%, unchanged from the previous week's rate. The advance number of those receiving unemployment insurance benefits during the week ended September 21 was 1,826,000, a decrease of 1,000 from the previous week's level, which was revised down by 7,000. States and territories with the highest insured unemployment rates for the week ended September 14 were New Jersey (2.3%), California (2.0%), Puerto Rico (1.9%), Rhode Island (1.8%), Washington (1.7%), Nevada (1.6%), Illinois (1.5%), Massachusetts (1.5%), New York (1.5%), and Pennsylvania (1.4%). The largest increases in initial claims for unemployment insurance for the week ended September 21 were in Virginia (+688), Washington (+596), Ohio (+584), Louisiana (+382), and North Carolina (+236), while the largest decreases were in New York (-1,510), Texas (-1,450), South Carolina (-641), Wisconsin (-532), and Massachusetts (-531).
Eye on the Week Ahead
The latest inflation data is available this week, with the release of the Consumer Price Index for September. The CPI inched up 0.2% in August and 2.5% since August 2023. Most forecasters predict September's data should be in line with the data from August.
Key Dates/Data Releases
10/8: International trade in goods and services
10/10: Consumer Price Index, Treasury budget statement
10/11: Producer Price Index
Data sources: Economic: Based on data from U.S. Bureau of Labor Statistics (unemployment, inflation); U.S. Department of Commerce (GDP, corporate profits, retail sales, housing); S&P/Case-Shiller 20-City Composite Index (home prices); Institute for Supply Management (manufacturing/services). Performance: Based on data reported in WSJ Market Data Center (indexes); U.S. Treasury (Treasury yields); U.S. Energy Information Administration/Bloomberg.com Market Data (oil spot price, WTI, Cushing, OK); www.goldprice.org (spot gold/silver); Oanda/FX Street (currency exchange rates).
News items are based on reports from multiple commonly available international news sources (i.e., wire services) and are independently verified when necessary with secondary sources such as government agencies, corporate press releases, or trade organizations. All information is based on sources deemed reliable, but no warranty or guarantee is made as to its accuracy or completeness. Neither the information nor any opinion expressed herein constitutes a solicitation for the purchase or sale of any securities, and should not be relied on as financial advice. Forecasts are based on current conditions, subject to change, and may not come to pass. U.S. Treasury securities are guaranteed by the federal government as to the timely payment of principal and interest. The principal value of Treasury securities and other bonds fluctuates with market conditions. Bonds are subject to inflation, interest-rate, and credit risks. As interest rates rise, bond prices typically fall. A bond sold or redeemed prior to maturity may be subject to loss. Past performance is no guarantee of future results. All investing involves risk, including the potential loss of principal, and there can be no guarantee that any investing strategy will be successful.
The Dow Jones Industrial Average (DJIA) is a price-weighted index composed of 30 widely traded blue-chip U.S. common stocks. The S&P 500 is a market-cap weighted index composed of the common stocks of 500 largest, publicly traded companies in leading industries of the U.S. economy. The NASDAQ Composite Index is a market-value weighted index of all common stocks listed on the Nasdaq stock exchange. The Russell 2000 is a market-cap weighted index composed of 2,000 U.S. small-cap common stocks. The Global Dow is an equally weighted index of 150 widely traded blue-chip common stocks worldwide. The U.S. Dollar Index is a geometrically weighted index of the value of the U.S. dollar relative to six foreign currencies. Market indexes listed are unmanaged and are not available for direct investment.
This material was written and prepared by Broadridge Advisor Solutions. © 2006-2019 Broadridge Investor Communication Solutions, Inc. Broadridge Investor Communication Solutions, Inc. does not provide investment, tax, or legal advice. The information presented here is not specific to any individual's personal circumstances. To the extent that this material concerns tax matters, it is not intended or written to be used, and cannot be used, by a taxpayer for the purpose of avoiding penalties that may be imposed by law. Each taxpayer should seek independent advice from a tax professional based on his or her individual circumstances. These materials are provided for general information and educational purposes based upon publicly available information from sources believed to be reliable—we cannot assure the accuracy or completeness of these materials. The information in these materials may change at any time and without notice. Prepared by Broadridge Investor Communication Solutions, Inc., copyright 2024.