The interest rate decrease by the Federal Reserve helped drive stocks higher last week. Each of the benchmark indexes listed here closed higher, led by the Russell 2000. Communication services, energy, and utilities were the best performing market sectors, while consumer staples, health care, and real estate lagged. Gold prices surged past $2,600.00 per ounce, hitting a new, record high on Friday. Crude oil prices advanced for the second straight week, while the dollar retreated following the drop in interest rates.
Stocks opened the week with mixed results as investors exercised some caution ahead of the Federal Reserve meeting later in the week. Nevertheless, the Dow rose 0.6%, hitting a new record high, while the Global Dow (0.5%), the Russell 2000 (0.3%), and the S&P 500 (0.1%) also advanced. The tech-heavy NASDAQ saw its rally stop after sliding 0.5%. Bond prices continued to advance with yields moving lower. Ten-year Treasury yields fell 2.9 basis points to 3.62%. Crude oil prices cracked the $70.00 per barrel threshold, closing at $70.45 per barrel. The dollar and gold prices declined.
Wall Street reflected caution last Tuesday as investors remained uncertain about the size of the anticipated interest rate cut. The small caps of the Russell 2000 led the benchmark indexes after climbing 0.7%. The NASDAQ inched up 0.2% and the S&P 500 ticked up less than 0.1%. The Global Dow and the Dow ended the session flat. Ten-year Treasury yields settled at 3.64%. Crude oil prices climbed 1.9% to $71.39 per barrel. The dollar gained 0.2%, while gold prices declined 0.5%.
Despite the Fed lowering interest rates by 50.0 basis points (see below), stocks ended last Wednesday ticking lower. The rate cut is the first in four years, and further adjustments to the Fed's monetary policy may now focus on the employment sector, which has slowed. The Fed meets two more times this year, and the likelihood of another rate cut of this size is minimal. Among the indexes listed here, only the Russell 2000 closed marginally in the black. The remaining indexes declined, with the Dow, the S&P 500, the NASDAQ, and the Global Dow each falling about 0.3%. Following news of the rate decrease, the dollar inched higher (0.2%), while gold prices fell 0.7%. Ten-year Treasury yields gained 4.3 basis points to close at 3.68%. The rally ended for crude oil prices, which fell 1.7% to $69.99 per barrel.
The interest rate cut from a day earlier boosted stocks last Thursday. Each of the benchmark indexes enjoyed notable gains, with the Dow and S&P 500 recording new record highs. A jump in tech stocks helped propel the NASDAQ 2.5%. The Russell 2000 rose 2.1%, the S&P 500 advanced 1.7%, and both the Dow and the Global Dow increased 1.3%. Ten-year Treasury yields settled at 3.74%, an increase of 5.5 basis points. Crude oil prices advanced 1.6% to $72.07 per barrel. The dollar ticked higher, while gold prices rose 0.5%.
Friday saw stocks close mostly lower, with only the Dow advancing 0.1%. Otherwise, the post-Fed rally waned as the remaining benchmark indexes listed here ended the session in the red. The Russell 2000 fell 1.1%, the NASDAQ dropped 0.4%, while the S&P 500 and the Global Dow each declined 0.2%. The yield on 10-year Treasuries slipped to 3.72%. Crude oil prices dipped 0.3% to $71.77 per barrel. The dollar inched up 0.1%, while gold prices advanced 1.2%.
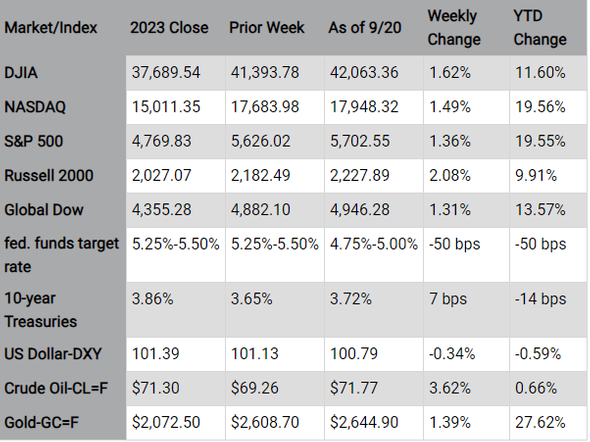
Chart reflects price changes, not total return. Because it does not include dividends or splits, it should not be used to benchmark performance of specific investments.
Last Week's Economic News
- The Federal Open Market Committee, by an 11-1 vote, moved to lower the fed funds target rate range by 50.0 basis points to 4.75%-5.00%. The lone dissenting vote was by Governor Michelle Bowman who preferred a 25.0-basis point reduction. The Committee's statement indicated that economic activity has continued to expand at a solid pace. Job gains have slowed and, while the unemployment rate has advanced, it remained low. In further support of the rate reduction, the Committee noted that it has gained greater confidence that inflation is moving sustainably toward the 2.0% target and that the risks to achieving its employment and inflation goals are roughly in balance. Further adjustments to the target range for the federal funds rate will be based on an assessment of incoming data, including readings on labor market conditions, inflation pressures and inflation expectations, and financial and international developments.
- Retail sales inched up 0.1% last month and advanced 2.1% since August 2023. Retail trade sales were up 0.1% in August and up 2.0% over the last 12 months. Nonstore (online) retailer sales were up 1.4% in August and rose 7.8% from last year, while food services and drinking places, which, while unchanged last month, were up 2.7% from August 2023.
- In August, industrial production rose 0.8% after falling 0.9% in July. Manufacturing output increased 0.9% in August after decreasing 0.7% during the previous month. This pattern was due in part to a recovery in the index of motor vehicles and parts, which jumped nearly 10.0% in August after dropping roughly 9.0% in July. Manufacturing excluding motor vehicles and parts moved up 0.3% in August. Mining climbed 0.8%, while the utilities index was unchanged from July. Total industrial production in August was the same as its year-earlier level. Capacity utilization moved up to 78.0% in August, a rate that is 1.7% below its long-run average.
- The number of issued residential building permits rose 4.9% in August. Single-family building permits increased 2.8% last month. However, since August 2023, residential building permits have fallen 6.5%. Housing starts in August advanced 9.6% and moved up 3.9% over the last 12 months. Single-family housing starts jumped 15.8% last month. Housing completions rose 9.2% in August and 30.2% above the August 2023 rate. Single-family housing completions declined 5.6% last month.
- August saw sales of existing homes fall 2.5% from July. Year over year, existing-home sales were down 4.2%. According to the report released by the National Association of Realtors®, despite the recent retraction in sales, lower mortgage rates and increasing inventory should drive sales higher in future months. Housing inventory sat a 4.2-month supply in August, up from the July estimate of 4.1 months. The median existing-home price in August was $416,700, down from July's price of $421,400 but up from the August 2023 value of $404,200. Single family home sales decreased 2.8% last month and declined 3.3% from the previous year. The median existing-single family home price was $422,100 in August, lower than the July price of $427,200 but well above the August 2023 price of $410,200. According to Freddie Mac, the 30-year fixed-rate mortgage averaged 6.20% as of September 12, down from 6.35% one week ago and 7.18% one year ago.
- The national average retail price for regular gasoline was $3.180 per gallon on September 16, $0.056 per gallon under the prior week's price and $0.698 per gallon less than a year ago. Also, as of September 16, the East Coast price fell $0.064 to $3.085 per gallon; the Midwest price decreased $0.093 to $3.005 per gallon; the Gulf Coast price dipped $0.072 to $2.728 per gallon; the Rocky Mountain price rose $0.043 to $3.400 per gallon; and the West Coast price increased $0.032 to $4.136 per gallon.
- For the week ended September 14, there were 219,000 new claims for unemployment insurance, a decrease of 12,000 from the previous week's level, which was revised up by 1,000. According to the Department of Labor, the advance rate for insured unemployment claims for the week ended September 7 was 1.2%, unchanged from the previous week's rate. The advance number of those receiving unemployment insurance benefits during the week ended September 7 was 1,829,000, a decrease of 14,000 from the previous week's level, which was revised down by 7,000. States and territories with the highest insured unemployment rates for the week ended August 31 were New Jersey (2.7%), Rhode Island (2.2%), California (2.0%), Puerto Rico (1.9%), Minnesota (1.7%), New York (1.7%), Washington (1.7%), Massachusetts (1.6%), Nevada (1.6%), Connecticut (1.5%), Illinois (1.5%), and Pennsylvania (1.5%). The largest increases in initial claims for unemployment insurance for the week ended September 7 were in Nebraska (+628), Wisconsin (+504), Iowa (+403), Virginia (+303), and Minnesota (+248), while the largest decreases were in New York (-2,878), California (-1,370), Ohio (-1,086), Michigan (-1,042), and Georgia (-891).
Eye on the Week Ahead
The final estimate for second quarter GDP is out this week. The prior estimate had the economy expanding at an annualized rate of 3.0%. The report on Personal Income and Outlays for August is also available this week. July saw personal income rise 0.3%, while personal consumption expenditures advanced 0.5%. Consumer prices rose 0.2% for July and 2.5% over the last 12 months ended in July.
Key Dates/Data Releases
9/25: New home sales
9/26: Durable goods orders, GDP
9/27: Personal Income and Outlays, international trade in goods
Data sources: Economic: Based on data from U.S. Bureau of Labor Statistics (unemployment, inflation); U.S. Department of Commerce (GDP, corporate profits, retail sales, housing); S&P/Case-Shiller 20-City Composite Index (home prices); Institute for Supply Management (manufacturing/services). Performance: Based on data reported in WSJ Market Data Center (indexes); U.S. Treasury (Treasury yields); U.S. Energy Information Administration/Bloomberg.com Market Data (oil spot price, WTI, Cushing, OK); www.goldprice.org (spot gold/silver); Oanda/FX Street (currency exchange rates).
News items are based on reports from multiple commonly available international news sources (i.e., wire services) and are independently verified when necessary with secondary sources such as government agencies, corporate press releases, or trade organizations. All information is based on sources deemed reliable, but no warranty or guarantee is made as to its accuracy or completeness. Neither the information nor any opinion expressed herein constitutes a solicitation for the purchase or sale of any securities, and should not be relied on as financial advice. Forecasts are based on current conditions, subject to change, and may not come to pass. U.S. Treasury securities are guaranteed by the federal government as to the timely payment of principal and interest. The principal value of Treasury securities and other bonds fluctuates with market conditions. Bonds are subject to inflation, interest-rate, and credit risks. As interest rates rise, bond prices typically fall. A bond sold or redeemed prior to maturity may be subject to loss. Past performance is no guarantee of future results. All investing involves risk, including the potential loss of principal, and there can be no guarantee that any investing strategy will be successful.
The Dow Jones Industrial Average (DJIA) is a price-weighted index composed of 30 widely traded blue-chip U.S. common stocks. The S&P 500 is a market-cap weighted index composed of the common stocks of 500 largest, publicly traded companies in leading industries of the U.S. economy. The NASDAQ Composite Index is a market-value weighted index of all common stocks listed on the Nasdaq stock exchange. The Russell 2000 is a market-cap weighted index composed of 2,000 U.S. small-cap common stocks. The Global Dow is an equally weighted index of 150 widely traded blue-chip common stocks worldwide. The U.S. Dollar Index is a geometrically weighted index of the value of the U.S. dollar relative to six foreign currencies. Market indexes listed are unmanaged and are not available for direct investment.
This material was written and prepared by Broadridge Advisor Solutions. © 2006-2019 Broadridge Investor Communication Solutions, Inc. Broadridge Investor Communication Solutions, Inc. does not provide investment, tax, or legal advice. The information presented here is not specific to any individual's personal circumstances. To the extent that this material concerns tax matters, it is not intended or written to be used, and cannot be used, by a taxpayer for the purpose of avoiding penalties that may be imposed by law. Each taxpayer should seek independent advice from a tax professional based on his or her individual circumstances. These materials are provided for general information and educational purposes based upon publicly available information from sources believed to be reliable—we cannot assure the accuracy or completeness of these materials. The information in these materials may change at any time and without notice.
Prepared by Broadridge Investor Communication Solutions, Inc., copyright 2024.