
Indiana Trust Wealth Management
Investment Advisory Services
by Clayton T. Bill, CFA
Vice President, Director of Investment Advisory Services
- The U.S. equity market, represented by the S&P 500 index, rose 0.6% for the week.
- U.S. stock market valuations have been elevated relative to long-term market history for the better part of the last 30 years. The ability of companies to generate free cash flow may help explain why.
The most popular stock market valuation metric is the price-to-earnings ratio (“P/E”) ratio, also referred to as the “earnings multiple”. The P/E takes the price per share of a stock, or all stocks in the market, and divides that figure by one year’s earnings per share. For example, NVIDIA’s P/E currently stands at 75x earnings. The S&P 500 is trading at 21x next year’s expected earnings. So, NVIDIA is viewed as more expensive relative to the U.S. stock market.
There are problems with using the P/E ratio to judge whether a stock is “cheap” or “expensive” on a relative basis. First, focusing upon one year’s earnings may not do the trick. If a company’s earnings are expected to grow rapidly, as with NVIDIA, that could (emphasis on “could”) justify an “expensive” P/E ratio relative to the market.
Another commonly used method by investors is to compare current valuations to average historical valuations. In doing so, investors may judge a stock or the market as being cheap or expensive with the implicit assumption that valuations are mean reverting.
Mean-reversion is a major assumption. Comparing current valuations to historical averages would have led one to believe that stocks have been overpriced for most of the last thirty years. Beginning in the mid-1990’s, U.S. stock market valuations rose relative to history. While there were brief periods of valuations more in-line with the long stretch of market history prior to 1990, such as the years immediately following the Great Financial Crisis of 2008, since the mid-1990’s equity valuations have remained relatively high.
The most-cited explanation for the persistence in high equity valuations is the contemporaneous decline in long-term interest rates. Until very recently, the ten-year U.S. Treasury note was on an inexorable march downward for decades. As interest rates fall, future cash flows become more valuable, boosting valuations (in theory).
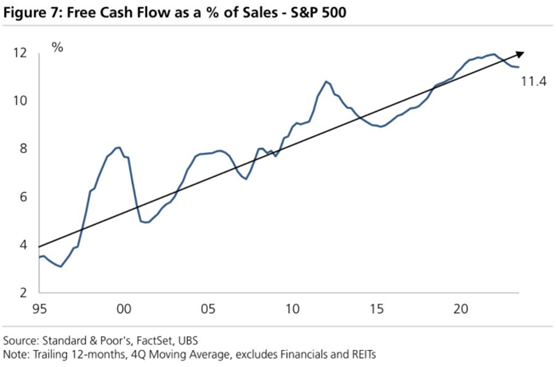
Perhaps lower interest rates are only part of the story. A recent note from UBS makes a different point – corporations have been able to convert sales into free cash flow at much higher rates than in the past. “Free cash flow” is the finance-version of accounting “earnings”. It is an attempt to gauge firms’ actual cash flow generation, free of the rigors of accrual accounting, championed by those with corporate finance degrees.
It appears that corporations put a major focus on free cash flow generation over the last thirty years. In 1995, free cash flow was 3% of sales at companies comprising the S&P 500. That figure stands close to 12% now, almost four times as high.
Why firms have been able to improve free cash flow generation from sales is a separate question, but investors have surely taken notice. It may be a contributor to the persistence of elevated equity valuations.
__________
IMPORTANT DISCLOSURES: All info contained herein is solely for general informational purposes. It does not take into account all the circumstances of each investor and is not to be construed as legal, accounting, investment, or other professional advice. The author(s) and publisher, accordingly, assume no liability whatsoever in connection with the use of this material or action taken in reliance thereon. All reasonable efforts have been made to ensure this material is correct at the time of publication. Copyright Indiana Trust Wealth Management 2024.