Stocks closed generally higher last week, with the Russell 2000, the Nasdaq, and the Global Dow posting gains, while the large caps of the Dow and the S&P 500 declined. Ten-year Treasury yields rose as bond prices fell. Crude oil prices gained about $1.00 per barrel. The dollar and gold prices inched higher. Investors are most likely reassessing their positions following the presidential debate between Joe Biden and Donald Trump. The majority of the market sectors declined last week, with utilities and materials falling the most. Consumer discretionary, communication services, and energy outperformed.
The week began with mixed results as the Nasdaq (-1.1%) and the S&P 500 (-0.3%) declined as a major AI company extended its losses for a third consecutive session, dragging the tech sector lower. The Dow (0.7%), the Global Dow (0.6%), and the Russell 2000 (0.5%) moved higher. Along with information technology, consumer discretionary was the only other sector to close in the red. The remaining market sectors gained ground, led by energy and utilities. Ten-year Treasury yields inched down to 4.24%. Crude oil prices closed at about $81.67 per barrel after gaining 1.2%. The dollar dipped 0.3%, while gold prices rose 0.6%.
The AI rally resumed last Tuesday, pushing the Nasdaq (1.3%) and the S&P 500 (0.4%) higher. The Dow gave back most of the prior day's gains after falling 0.8%. The Russell 2000 (-0.4%) edged lower while the Global Dow inched lower by less than 0.1%. Yields on 10-year Treasuries dipped to 4.23%. Crude oil prices reversed the previous day's gains after declining $0.90 to $80.77 per barrel. The dollar eked out a 0.2% gain, while gold prices fell 0.6%.
Once again, the market was mixed last Wednesday. The Nasdaq (0.5%) and the S&P 500 (0.2%) advanced for the second straight session. The Dow gained less than 0.1%. The Russell 2000 and the Global Dow fell 0.2%. Consumer discretionary outperformed among the market sectors, while energy and financials lagged. Bond prices declined, pushing yields higher, as 10-year Treasuries gained 7.8 basis points to close at 4.31%. Crude oil prices slipped to $80.66 per barrel. The dollar rose 0.4%, while gold prices dipped 0.9%.
Stocks closed higher last Thursday led by the Russell 2000, which gained 1.0%. The Nasdaq added 0.3%, while the Dow and the S&P 500 inched up 0.1%. The Global Dow dipped 0.2%. Ten-year Treasury yields dipped 2.8 basis points to settle at 4.28%. Crude oil prices rose nearly $1.00 to $81.86 per barrel. The dollar dipped 0.1%, while gold prices advanced 1.0%.
Friday's stock performance was lackluster, with each of the benchmark indexes listed here closing lower, except for the small caps of the Russell 2000, which gained 0.4%. The Nasdaq lost 0.7%, followed by the S&P 500 (-0.4%) and the Dow (-0.1%). The Global Dow fell less than 0.1%. Ten-year Treasury yields rose 5.5 basis points to close at 4.34%. Crude oil prices fell $0.40 per barrel. The dollar was flat, while gold prices slipped 0.1%.
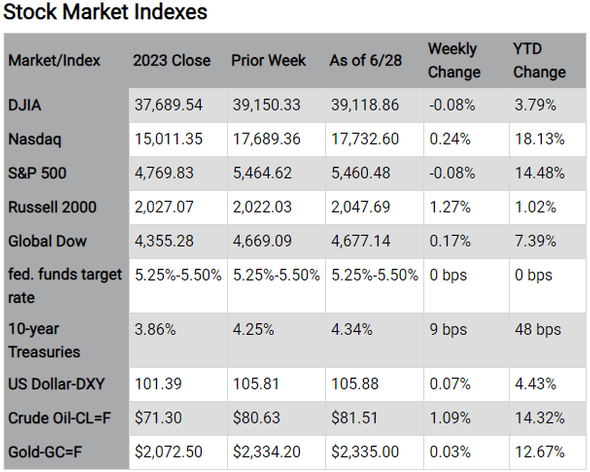
Chart reflects price changes, not total return. Because it does not include dividends or splits, it should not be used to benchmark performance of specific investments.
Last Week's Economic News
- The third and final estimate of first-quarter gross domestic product revealed that the economy accelerated at an annual rate of 1.4%. In the fourth quarter, GDP increased by 3.4%. Compared to the fourth quarter, the reduction in GDP primarily reflected decelerations in consumer spending, exports, and state and local government spending, and a downturn in federal government spending. These decreases were partly offset by an acceleration in residential fixed investment. Imports, which are a negative in the calculation of GDP, accelerated. The personal consumption expenditures (PCE) price index increased 3.4%, an upward revision of 0.1 percentage point from the fourth quarter. Excluding food and energy prices, the PCE price index increased 3.7%, also 0.1 percentage point above the fourth-quarter estimate.
- In what will likely give rise to hopes that the Federal Reserve will lower interest rates in the third quarter, consumer prices were unchanged in May, according to the latest personal consumption expenditures (PCE) price index. Core prices (less food and energy) ticked up 0.1% last month. Year over year, both the PCE price index and the core PCE price index rose 2.6%, a reduction of 0.1% and 0.2%, respectively, from the same period ended in April. Consumer spending inched up 0.2% in May, while personal income rose 0.5%, largely attributable to a 0.7% rise in wages and salaries.
- The advance estimate of international trade in goods showed the trade deficit rose by 2.7% in May. Exports declined 2.7%, while imports fell 0.7%.
- New orders for durable goods inched up 0.1% in May following a downwardly revised 0.2% increase in April. Excluding transportation, orders for durable goods ticked down 0.1%. Excluding defense, new orders decreased 0.2%. Transportation equipment, up three of the last four months, drove the overall increase in new orders, increasing 0.6%.
- Sales of new single-family homes declined 11.3% in May and 16.5% under the May 2023 estimate. The median sales price of new houses sold in May was $417,400. The average sales price was $520,000. Inventory of new single-family homes for sale in May represented a 9.3-month supply at the current sales pace.
- The national average retail price for regular gasoline was $3.438 per gallon on June 24, $0.003 per gallon above the prior week's price but $0.133 per gallon less than a year ago. Also, as of June 24, the East Coast price rose $0.006 to $3.363 per gallon; the Midwest price increased $0.008 to $3.323 per gallon; the Gulf Coast price advanced $0.024 to $3.016 per gallon; the Rocky Mountain price declined $0.034 to $3.296 per gallon; and the West Coast price fell $0.025 to $4.268 per gallon.
- For the week ended June 22, there were 233,000 new claims for unemployment insurance, a decrease of 6,000 from the previous week's level, which was revised up by 1,000. According to the Department of Labor, the advance rate for insured unemployment claims for the week ended June 15 was 1.2%, unchanged from the previous week's rate. The advance number of those receiving unemployment insurance benefits during the week ended June 15 was 1,839,000, an increase of 18,000 from the previous week's level, which was revised down by 7,000. This is the highest level for insured unemployment since November 27, 2021, when it was 1,878,000. States and territories with the highest insured unemployment rates for the week ended June 8 were New Jersey (2.2%), California (2.1%), Minnesota (1.8%), Washington (1.7%), Illinois (1.6%), Massachusetts (1.6%), Nevada (1.6%), Pennsylvania (1.6%), Rhode Island (1.6%), New York (1.5%), and Puerto Rico (1.5%). The largest increases in initial claims for unemployment insurance for the week ended June 15 were in Connecticut (+2,168), Wisconsin (+1,262), Texas (+1,017), New Jersey (+962), and Maryland (+756), while the largest decreases were in California (-4,298), Minnesota (-1,474), Illinois (-1,466), New York (-1,193), and Florida (-1,134).
Eye on the Week Ahead
The jobs report for May is out this week. Employment picked up in April, with 272,000 estimated new jobs added. Strength in the labor sector supports the Federal Reserve's restrictive monetary policy, particularly relative to interest rates.
Key Dates/Data Releases
7/1: S&P Global Manufacturing PMI
7/2: JOLTS
7/3: International trade in goods and services, S&P Global Services PMI
7/5: Employment situation
Data sources: Economic: Based on data from U.S. Bureau of Labor Statistics (unemployment, inflation); U.S. Department of Commerce (GDP, corporate profits, retail sales, housing); S&P/Case-Shiller 20-City Composite Index (home prices); Institute for Supply Management (manufacturing/services). Performance: Based on data reported in WSJ Market Data Center (indexes); U.S. Treasury (Treasury yields); U.S. Energy Information Administration/Bloomberg.com Market Data (oil spot price, WTI, Cushing, OK); www.goldprice.org (spot gold/silver); Oanda/FX Street (currency exchange rates).
News items are based on reports from multiple commonly available international news sources (i.e., wire services) and are independently verified when necessary with secondary sources such as government agencies, corporate press releases, or trade organizations. All information is based on sources deemed reliable, but no warranty or guarantee is made as to its accuracy or completeness. Neither the information nor any opinion expressed herein constitutes a solicitation for the purchase or sale of any securities, and should not be relied on as financial advice. Forecasts are based on current conditions, subject to change, and may not come to pass. U.S. Treasury securities are guaranteed by the federal government as to the timely payment of principal and interest. The principal value of Treasury securities and other bonds fluctuates with market conditions. Bonds are subject to inflation, interest-rate, and credit risks. As interest rates rise, bond prices typically fall. A bond sold or redeemed prior to maturity may be subject to loss. Past performance is no guarantee of future results. All investing involves risk, including the potential loss of principal, and there can be no guarantee that any investing strategy will be successful.
The Dow Jones Industrial Average (DJIA) is a price-weighted index composed of 30 widely traded blue-chip U.S. common stocks. The S&P 500 is a market-cap weighted index composed of the common stocks of 500 largest, publicly traded companies in leading industries of the U.S. economy. The NASDAQ Composite Index is a market-value weighted index of all common stocks listed on the NASDAQ stock exchange. The Russell 2000 is a market-cap weighted index composed of 2,000 U.S. small-cap common stocks. The Global Dow is an equally weighted index of 150 widely traded blue-chip common stocks worldwide. The U.S. Dollar Index is a geometrically weighted index of the value of the U.S. dollar relative to six foreign currencies. Market indexes listed are unmanaged and are not available for direct investment.
This material was written and prepared by Broadridge Advisor Solutions. © 2006-2019 Broadridge Investor Communication Solutions, Inc. Broadridge Investor Communication Solutions, Inc. does not provide investment, tax, or legal advice. The information presented here is not specific to any individual's personal circumstances. To the extent that this material concerns tax matters, it is not intended or written to be used, and cannot be used, by a taxpayer for the purpose of avoiding penalties that may be imposed by law. Each taxpayer should seek independent advice from a tax professional based on his or her individual circumstances. These materials are provided for general information and educational purposes based upon publicly available information from sources believed to be reliable—we cannot assure the accuracy or completeness of these materials. The information in these materials may change at any time and without notice. Prepared by Broadridge Investor Communication Solutions, Inc., copyright 2024.